

AP Statistics
biểu đồ phần dưresidual plot
residual plotVietnamese: biểu đồ phần dư
Còn gọi:Also called: đồ thị phần dư
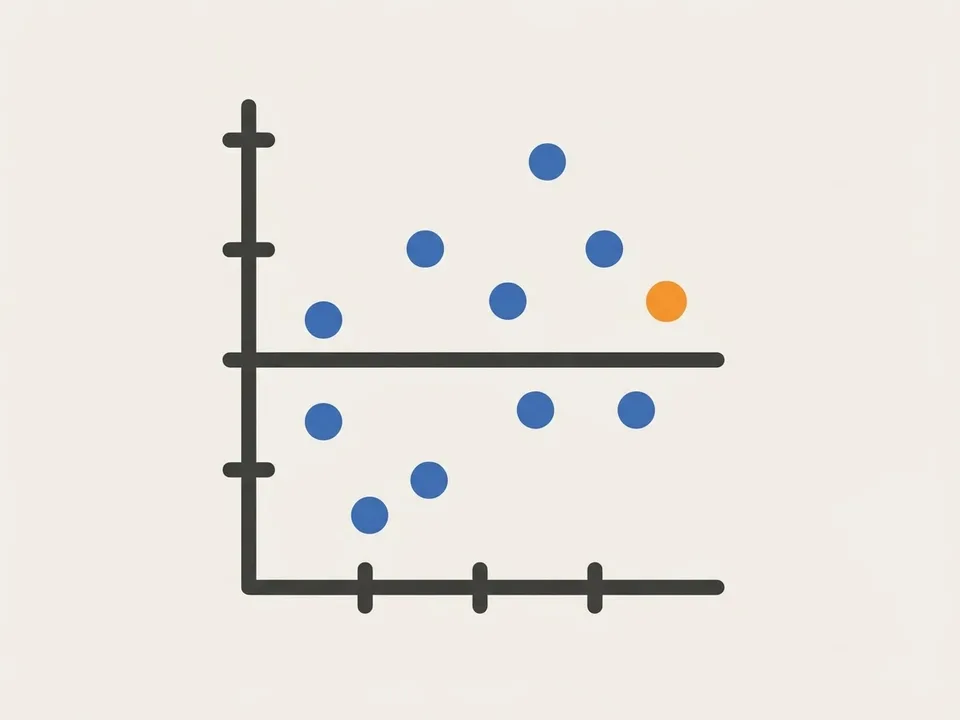
Biểu đồ phần dư là đồ thị phân tán vẽ phần dư theo giá trị dự đoán hoặc theo biến x, dùng để đánh giá mức độ phù hợp của mô hình hồi quy tuyến tính.A residual plot is a scatterplot of the residuals against the predicted values or against the explanatory variable , used to judge how well a linear regression model fits.
Trực giác: Hãy tưởng tượng bạn ném phi tiêu vào bia: biểu đồ phần dư giống như việc bạn chụp lại vị trí từng mũi phi tiêu so với hồng tâm rồi trải phẳng ra — nếu chúng rải đều quanh tâm, bạn biết mình ném khá chuẩn; nếu chúng xếp thành hình vòng cung lệch một bên, bạn hiểu có gì đó sai trong cách ngắm.Intuition: Picture throwing darts at a board: a residual plot is like photographing where each dart landed relative to the bullseye and then flattening those misses out on one graph. If the hits scatter evenly around the center, your aim is good; if they bend into an arc off to one side, something is wrong with how you are aiming.
Công thức chínhKey formula
Định nghĩa đầy đủFull definition1 phút đọc1 min read
Biểu đồ phần dư biểu diễn chênh lệch giữa giá trị quan sát và giá trị dự đoán trên trục tung, theo giá trị dự đoán hoặc biến trên trục hoành. Các điểm rải ngẫu nhiên quanh đường 0 và không có mẫu hình rõ rệt ủng hộ việc dùng mô hình tuyến tính; dạng cong cho thấy quan hệ phi tuyến chưa được mô hình nắm bắt. Sự rải ngẫu nhiên không có nghĩa hai biến không liên hệ, vì trục tung là sai lệch dự đoán.
A residual plot puts the difference between each observed value and its predicted value on the vertical axis, graphed against the predicted value or against on the horizontal axis. Points scattered randomly around the line at 0 with no clear pattern support using a linear model; a curved pattern signals a nonlinear relationship the model has not captured. Random scatter does not mean the two variables are unrelated, since the vertical axis shows prediction error, not the response itself.
Giải nghĩa công thứcFormula breakdown1 công thức1 formula
Dùng sau khi tìm đường hồi quy để tính phần dư, rồi xét chúng rải ngẫu nhiên quanh 0 hay tạo mẫu hình.Use this after finding the regression line to compute each residual, then check whether the residuals scatter randomly around 0 or form a pattern.
Trong đóWhere
Hay hiểu saiCommon misconceptions3 ý · 1 phút đọc3 points · 1 min read
Không có mẫu hình rõ rệt mới là dấu hiệu tốt trên biểu đồ phần dư.
Các điểm rải ngẫu nhiên quanh đường 0 ủng hộ mô hình tuyến tính. Dạng cong hoặc sóng cho thấy cấu trúc còn sót lại.
Hệ số tương quan lớn không chứng minh mô hình tuyến tính phù hợp.
Quan hệ cong vẫn có thể cho hệ số tương quan lớn. Khi có biểu đồ phần dư, hãy dựa vào hình dạng thay vì dùng hoặc để bảo vệ tính tuyến tính.
Một phần dư lớn riêng lẻ không phải là mẫu hình.
Mẫu hình phải lặp lại có hệ thống trên dải giá trị; điểm lẻ cần bình luận riêng. Phần dư âm nghĩa là mô hình dự đoán cao hơn giá trị quan sát.
On a residual plot, the absence of a clear pattern is the good sign.
Points scattered randomly around the line at 0 support a linear model, while a curved or wavy shape shows leftover structure the line missed.
A large correlation coefficient does not prove that a linear model fits.
A curved relationship can still produce a large correlation, so when a residual plot is provided, argue from its shape rather than citing or to defend linearity.
A single large residual is not a pattern.
A pattern must repeat systematically across the range of values; an isolated point deserves its own separate comment. A negative residual means the model predicted higher than the observed value.
Mẹo phòng thiExam tips2 mẹo2 tips
Hãy mô tả biểu đồ trước khi kết luận.
Nêu các điểm có rải ngẫu nhiên quanh đường 0 và có mẫu hình hay không; sau đó kết luận mô hình tuyến tính phù hợp hay không.
Khi chọn giữa các biểu đồ phần dư, xét mẫu hình chứ không xét độ hẹp.
Điểm sát đường 0 nhưng tạo vòng cung vẫn không đạt; đám điểm rộng nhưng không có mẫu hình có thể phù hợp. Dạng phễu cho thấy độ biến động phần dư thay đổi theo .
Describe the plot before you draw a conclusion.
State whether the points scatter randomly around the line at 0 and whether any pattern appears, then conclude whether a linear model is appropriate.
When choosing among residual plots, look at pattern, not at how narrow the scatter is.
Points hugging the line at 0 but forming an arc still fail, while a wide band with no pattern can be fine. A funnel shape shows that the variability of the residuals changes with .
Khái niệm này sinh ra từ đâuWhere the concept comes from1 phút đọc1 min read
Carl Friedrich Gauss
Vì sao mang đúng cái tên này? Tên gọi bắt nguồn từ tiếng Latinh "residuum", nghĩa là "phần còn lại". Sau khi mô hình đã lấy đi phần biến thiên mà nó giải thích được, cái còn sót lại giữa giá trị thực và giá trị dự đoán (fitted value) chính là phần dư. Vì vậy biểu đồ vẽ các phần dư này theo biến giải thích (explanatory variable) mang đúng tên đó: nó trưng ra phần dữ liệu mà đường thẳng chưa nói hết, chứ không trưng ra bản thân xu hướng.
Thử nghiệm tương tácInteractive explorer
%22%20stroke-width%3D%222.4%22%2F%3E%3Ccircle%20cx%3D%2288.1%22%20cy%3D%22249.7%22%20r%3D%225.5%22%20fill%3D%22var(--accent-soft%2C%23ede9fe)%22%20stroke%3D%22var(--accent-strong%2C%237c3aed)%22%20stroke-width%3D%221.6%22%2F%3E%3Ccircle%20cx%3D%22126.3%22%20cy%3D%22243.6%22%20r%3D%225.5%22%20fill%3D%22var(--accent-soft%2C%23ede9fe)%22%20stroke%3D%22var(--accent-strong%2C%237c3aed)%22%20stroke-width%3D%221.6%22%2F%3E%3Ccircle%20cx%3D%22164.4%22%20cy%3D%22224.2%22%20r%3D%225.5%22%20fill%3D%22var(--accent-soft%2C%23ede9fe)%22%20stroke%3D%22var(--accent-strong%2C%237c3aed)%22%20stroke-width%3D%221.6%22%2F%3E%3Ccircle%20cx%3D%22202.5%22%20cy%3D%22223.1%22%20r%3D%225.5%22%20fill%3D%22var(--accent-soft%2C%23ede9fe)%22%20stroke%3D%22var(--accent-strong%2C%237c3aed)%22%20stroke-width%3D%221.6%22%2F%3E%3Ccircle%20cx%3D%22240.7%22%20cy%3D%22203.0%22%20r%3D%225.5%22%20fill%3D%22var(--accent-soft%2C%23ede9fe)%22%20stroke%3D%22var(--accent-strong%2C%237c3aed)%22%20stroke-width%3D%221.6%22%2F%3E%3Ccircle%20cx%3D%22278.8%22%20cy%3D%22196.1%22%20r%3D%225.5%22%20fill%3D%22var(--accent-soft%2C%23ede9fe)%22%20stroke%3D%22var(--accent-strong%2C%237c3aed)%22%20stroke-width%3D%221.6%22%2F%3E%3Ccircle%20cx%3D%22316.9%22%20cy%3D%22177.9%22%20r%3D%225.5%22%20fill%3D%22var(--accent-soft%2C%23ede9fe)%22%20stroke%3D%22var(--accent-strong%2C%237c3aed)%22%20stroke-width%3D%221.6%22%2F%3E%3Ccircle%20cx%3D%22355.1%22%20cy%3D%22176.0%22%20r%3D%225.5%22%20fill%3D%22var(--accent-soft%2C%23ede9fe)%22%20stroke%3D%22var(--accent-strong%2C%237c3aed)%22%20stroke-width%3D%221.6%22%2F%3E%3Ccircle%20cx%3D%22393.2%22%20cy%3D%22159.3%22%20r%3D%225.5%22%20fill%3D%22var(--accent-soft%2C%23ede9fe)%22%20stroke%3D%22var(--accent-strong%2C%237c3aed)%22%20stroke-width%3D%221.6%22%2F%3E%3Ccircle%20cx%3D%22431.3%22%20cy%3D%22153.9%22%20r%3D%225.5%22%20fill%3D%22var(--accent-soft%2C%23ede9fe)%22%20stroke%3D%22var(--accent-strong%2C%237c3aed)%22%20stroke-width%3D%221.6%22%2F%3E%3Ccircle%20cx%3D%22469.5%22%20cy%3D%22133.8%22%20r%3D%225.5%22%20fill%3D%22var(--accent-soft%2C%23ede9fe)%22%20stroke%3D%22var(--accent-strong%2C%237c3aed)%22%20stroke-width%3D%221.6%22%2F%3E%3Ccircle%20cx%3D%22507.6%22%20cy%3D%22128.5%22%20r%3D%225.5%22%20fill%3D%22var(--accent-soft%2C%23ede9fe)%22%20stroke%3D%22var(--accent-strong%2C%237c3aed)%22%20stroke-width%3D%221.6%22%2F%3E%3Ccircle%20cx%3D%22545.7%22%20cy%3D%22111.4%22%20r%3D%225.5%22%20fill%3D%22var(--accent-soft%2C%23ede9fe)%22%20stroke%3D%22var(--accent-strong%2C%237c3aed)%22%20stroke-width%3D%221.6%22%2F%3E%3Ccircle%20cx%3D%22583.9%22%20cy%3D%22104.2%22%20r%3D%225.5%22%20fill%3D%22var(--accent-soft%2C%23ede9fe)%22%20stroke%3D%22var(--accent-strong%2C%237c3aed)%22%20stroke-width%3D%221.6%22%2F%3E%3Cline%20x1%3D%2250%22%20x2%3D%22622%22%20y1%3D%22282%22%20y2%3D%22282%22%20stroke%3D%22var(--text-faint%2C%2394a3b8)%22%20stroke-width%3D%221.2%22%2F%3E%3Cline%20x1%3D%2250%22%20x2%3D%2250%22%20y1%3D%2216%22%20y2%3D%22282%22%20stroke%3D%22var(--text-faint%2C%2394a3b8)%22%20stroke-width%3D%221.2%22%2F%3E%3Ctext%20x%3D%22320%22%20y%3D%22312%22%20text-anchor%3D%22middle%22%20font-size%3D%2212%22%20fill%3D%22var(--text-muted%2C%2364748b)%22%3Ex%20(bi%E1%BA%BFn%20gi%E1%BA%A3i%20th%C3%ADch)%3C%2Ftext%3E%3Ctext%20x%3D%2214%22%20y%3D%22149%22%20text-anchor%3D%22middle%22%20font-size%3D%2212%22%20fill%3D%22var(--text-muted%2C%2364748b)%22%20transform%3D%22rotate(-90%2014%20149)%22%3Ey%20(bi%E1%BA%BFn%20ph%E1%BA%A3n%20h%E1%BB%93i)%3C%2Ftext%3E%3C%2Fsvg%3E)
Kéo đám điểm cho cong lại — nhìn biểu đồ phần dư uốn thành chữ U
Kéo tham số, thấy khái niệm chuyển động — đăng nhập để mở.Drag the parameters and watch the concept move — sign in to open.
Bạn nắm chắc chưa?Check your understanding
Quiz câu thật từ ngân hàng đềReal exam questions from our question bank
Vài câu thật gắn đúng khái niệm này, chấm ngay kèm giải thích từng đáp án — hệ thống ghi nhớ bạn nắm tới đâu.A few real questions on exactly this concept, graded instantly with an explanation for every choice — the system remembers how well you know it.
Học tiếp từ đâyKeep learning
Hay nhầm vớiOften confused with
Cùng chủ đềSame topic
- biến phản hồiresponse variable
- giá trị dự đoánpredicted value
- biến giải thíchexplanatory variable
- điểm có đòn bẩy caohigh-leverage point
- đường hồi quyregression line
- giá trị quan sátobserved values
- hệ số tương quancorrelation coefficient
- hệ số xác địnhcoefficient of determination
- liên hệ tuyến tínhlinear association
- mối quan hệ âmnegative relationship
- mối quan hệ thuậnpositive relationship
- ngoại suyextrapolation
Nguồn tham khảoReferences
- [1]Barron_AP_Stat_2026. tr. 204, 212, 219.
Biên soạn bởi DucklingStudy, bản quyền thuộc DucklingStudy.Written by DucklingStudy. © DucklingStudy. Xuất bảnPublished .