

AP Statistics
khoảng biến thiênrange
rangeVietnamese: khoảng biến thiên
Còn gọi:Also called: biên độ · khoảng
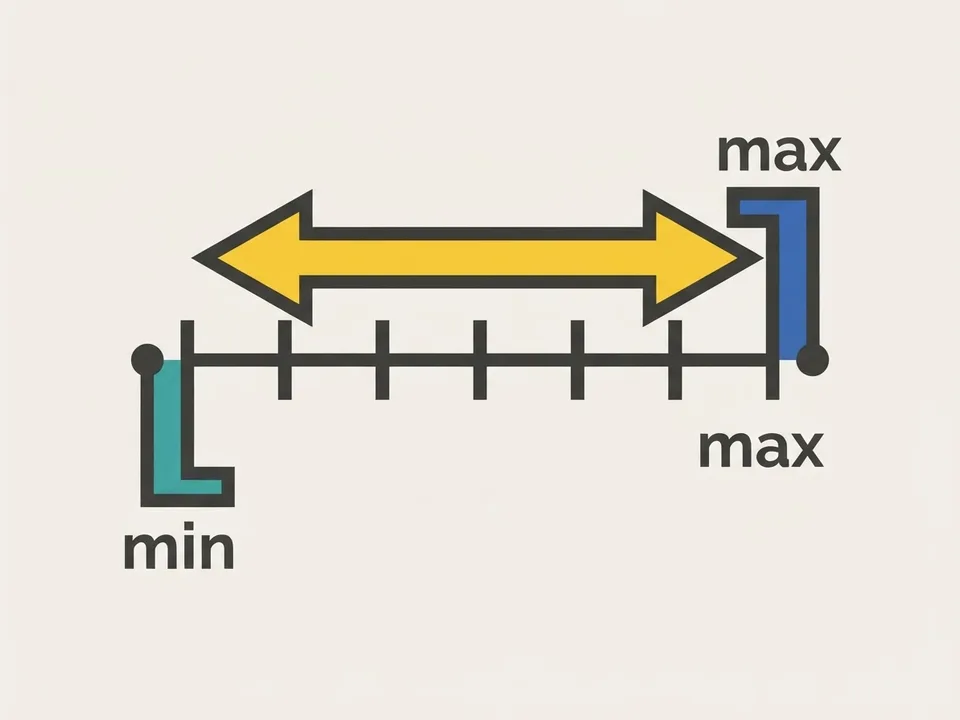
Khoảng biến thiên là số đo độ phân tán đơn giản nhất của một tập dữ liệu, được tính bằng hiệu giữa giá trị lớn nhất và giá trị nhỏ nhất.The range is the simplest measure of spread for a data set: the maximum value minus the minimum value.
Trực giác: Khoảng biến thiên giống như chiều dài của cái thước đủ để phủ hết toàn bộ dữ liệu từ điểm nhỏ nhất đến điểm lớn nhất.Intuition: Think of the range as the length of ruler you would need to cover all of the data, from the smallest point to the largest.
Công thức chínhKey formula
Định nghĩa đầy đủFull definition1 phút đọc1 min read
Khoảng biến thiên (range) biểu thị bề rộng toàn bộ tập dữ liệu trên trục số; lấy cực đại trừ cực tiểu. Kết quả không âm, cùng đơn vị với dữ liệu, không đổi khi cộng cùng một hằng số và được nhân với khi mọi quan sát nhân với .
Vì chỉ phụ thuộc hai đầu mút, đại lượng này rất nhạy với giá trị ngoại lai. Khi có ngoại lai, khoảng tứ phân vị thường được ưu tiên vì chỉ đo 50% dữ liệu giữa.
The range measures the total width of a data set on the number line: subtract the minimum from the maximum. It is never negative, carries the same units as the data, stays the same when a constant is added to every observation, and is multiplied by when every observation is multiplied by .
Because it depends on only the two endpoints, the range is extremely sensitive to outliers. When outliers are present, the interquartile range is usually preferred, since it describes only the middle 50% of the data.
Giải nghĩa công thứcFormula breakdown1 công thức1 formula
Dùng khi cần tính nhanh độ trải rộng từ hai giá trị cực trị hoặc từ bản tóm tắt năm số.Use this when you need a quick measure of spread from the two extreme values or from a five-number summary.
Trong đóWhere
Hay hiểu saiCommon misconceptions3 ý · 1 phút đọc3 points · 1 min read
Khoảng biến thiên là một số, không phải đoạn từ nhỏ nhất đến lớn nhất.
Phải lấy giá trị lớn nhất trừ giá trị nhỏ nhất; kết quả không âm và cùng đơn vị với dữ liệu.
Khoảng biến thiên không phải khoảng tứ phân vị.
Khoảng biến thiên dùng hai giá trị cực trị; khoảng tứ phân vị dùng và đo 50% dữ liệu giữa. Vì thế, khoảng biến thiên nhạy với ngoại lai, và hai bộ dữ liệu có cùng khoảng biến thiên vẫn có thể phân bố khác nhau.
Không thể đọc chính xác khoảng biến thiên từ dữ liệu ghép nhóm.
Ta chỉ biết các cực trị nằm trong nhóm đầu và nhóm cuối. Hiệu giữa mép phải nhóm cuối và mép trái nhóm đầu chỉ là một ước lượng.
The range is a single number, not the interval from the minimum to the maximum.
Subtract the minimum from the maximum; the result is nonnegative and has the same units as the data.
The range is not the interquartile range.
The range uses the two extreme values, while the IQR is and describes the middle 50% of the data. That is why the range reacts strongly to outliers, and why two data sets with the same range can still be distributed quite differently.
You cannot read an exact range from grouped data.
All you know is that the extremes lie somewhere in the first and last classes, so the distance from the left edge of the first class to the right edge of the last class is only an estimate.
Mẹo phòng thiExam tips2 mẹo2 tips
Hãy trình bày phép trừ và ghi đơn vị ở kết quả.
Khoảng biến thiên cùng đơn vị với dữ liệu; phép tính cũng cho thấy bạn đã dùng hai đầu mút đúng cách.
Đừng dùng khoảng biến thiên một mình để mô tả hoặc so sánh phân bố.
Hãy xét cả hình dạng, trung tâm và ngoại lai. Hai nhóm cùng khoảng biến thiên vẫn có thể phân bố khác; với dữ liệu lệch hoặc có ngoại lai, ưu tiên khoảng tứ phân vị và nêu lý do.
Show the subtraction and attach units to your answer.
The range has the same units as the data, and writing the calculation shows you used the two endpoints correctly.
Never describe or compare distributions using the range alone.
Discuss shape, center, and outliers as well. Two groups with equal ranges can still differ in distribution; for skewed data or data with outliers, prefer the IQR and say why.
Thử nghiệm tương tácInteractive explorer
%22%20stroke%3D%22var(--accent-strong%2C%237c3aed)%22%20stroke-width%3D%221.6%22%2F%3E%3Ccircle%20cx%3D%22144.8%22%20cy%3D%22184.0%22%20r%3D%229%22%20fill%3D%22var(--accent-soft%2C%23ede9fe)%22%20stroke%3D%22var(--accent-strong%2C%237c3aed)%22%20stroke-width%3D%221.6%22%2F%3E%3Ccircle%20cx%3D%22157.8%22%20cy%3D%22184.0%22%20r%3D%229%22%20fill%3D%22var(--accent-soft%2C%23ede9fe)%22%20stroke%3D%22var(--accent-strong%2C%237c3aed)%22%20stroke-width%3D%221.6%22%2F%3E%3Ccircle%20cx%3D%22170.8%22%20cy%3D%22184.0%22%20r%3D%229%22%20fill%3D%22var(--accent-soft%2C%23ede9fe)%22%20stroke%3D%22var(--accent-strong%2C%237c3aed)%22%20stroke-width%3D%221.6%22%2F%3E%3Ccircle%20cx%3D%22183.7%22%20cy%3D%22184.0%22%20r%3D%229%22%20fill%3D%22var(--accent-soft%2C%23ede9fe)%22%20stroke%3D%22var(--accent-strong%2C%237c3aed)%22%20stroke-width%3D%221.6%22%2F%3E%3Ccircle%20cx%3D%22183.7%22%20cy%3D%22165.0%22%20r%3D%229%22%20fill%3D%22var(--accent-soft%2C%23ede9fe)%22%20stroke%3D%22var(--accent-strong%2C%237c3aed)%22%20stroke-width%3D%221.6%22%2F%3E%3Ccircle%20cx%3D%22196.7%22%20cy%3D%22184.0%22%20r%3D%229%22%20fill%3D%22var(--accent-soft%2C%23ede9fe)%22%20stroke%3D%22var(--accent-strong%2C%237c3aed)%22%20stroke-width%3D%221.6%22%2F%3E%3Ccircle%20cx%3D%22209.7%22%20cy%3D%22184.0%22%20r%3D%229%22%20fill%3D%22var(--accent-soft%2C%23ede9fe)%22%20stroke%3D%22var(--accent-strong%2C%237c3aed)%22%20stroke-width%3D%221.6%22%2F%3E%3Ccircle%20cx%3D%22222.7%22%20cy%3D%22184.0%22%20r%3D%229%22%20fill%3D%22var(--accent-soft%2C%23ede9fe)%22%20stroke%3D%22var(--accent-strong%2C%237c3aed)%22%20stroke-width%3D%221.6%22%2F%3E%3Ccircle%20cx%3D%22235.6%22%20cy%3D%22184.0%22%20r%3D%229%22%20fill%3D%22var(--accent-soft%2C%23ede9fe)%22%20stroke%3D%22var(--accent-strong%2C%237c3aed)%22%20stroke-width%3D%221.6%22%2F%3E%3Ccircle%20cx%3D%22248.6%22%20cy%3D%22184.0%22%20r%3D%229%22%20fill%3D%22var(--accent-soft%2C%23ede9fe)%22%20stroke%3D%22var(--accent-strong%2C%237c3aed)%22%20stroke-width%3D%221.6%22%2F%3E%3Ccircle%20cx%3D%22274.6%22%20cy%3D%22184.0%22%20r%3D%229%22%20fill%3D%22var(--accent-soft%2C%23ede9fe)%22%20stroke%3D%22var(--accent-strong%2C%237c3aed)%22%20stroke-width%3D%221.6%22%2F%3E%3Cline%20x1%3D%2228%22%20x2%3D%22612%22%20y1%3D%22194%22%20y2%3D%22194%22%20stroke%3D%22var(--text-faint%2C%2394a3b8)%22%20stroke-width%3D%221.2%22%2F%3E%3Ctext%20x%3D%22320%22%20y%3D%22238%22%20text-anchor%3D%22middle%22%20font-size%3D%2212%22%20fill%3D%22var(--text-muted%2C%2364748b)%22%3ETh%E1%BB%9Di%20gian%20t%E1%BB%B1%20h%E1%BB%8Dc%20m%E1%BB%97i%20ng%C3%A0y%20(ph%C3%BAt)%3C%2Ftext%3E%3C%2Fsvg%3E)
Kéo chấm rìa ra xa — thanh max − min dài ra, khoảng tứ phân vị đứng yên
Kéo tham số, thấy khái niệm chuyển động — đăng nhập để mở.Drag the parameters and watch the concept move — sign in to open.
Bạn nắm chắc chưa?Check your understanding
Quiz câu thật từ ngân hàng đềReal exam questions from our question bank
Vài câu thật gắn đúng khái niệm này, chấm ngay kèm giải thích từng đáp án — hệ thống ghi nhớ bạn nắm tới đâu.A few real questions on exactly this concept, graded instantly with an explanation for every choice — the system remembers how well you know it.
Học tiếp từ đâyKeep learning
Hay nhầm vớiOften confused with
Cùng chủ đềSame topic
- thống kê bền vững (resistant)resistant statistic
- tứ phân vị thứ nhấtfirst quartile
- boxplotboxplot
- cụm (trong phân phối dữ liệu)cluster
- đặc điểm bất thường (của phân phối)unusual features
- độ lệch (so với trung bình)deviation
- giá trị lớn nhấtmaximum
- giá trị nhỏ nhấtminimum
- khoảng trống (trong phân phối dữ liệu)gap
- mốtmode
- một đỉnhunimodal
- phân phối lệch tráiskewed left
Nguồn tham khảoReferences
- [1]Barron_AP_Stat_2026. tr. 100, 115, 120.
Biên soạn bởi DucklingStudy, bản quyền thuộc DucklingStudy.Written by DucklingStudy. © DucklingStudy. Xuất bảnPublished .