

AP Statistics
hệ số tương quancorrelation coefficient
correlation coefficientVietnamese: hệ số tương quan
Còn gọi:Also called: r
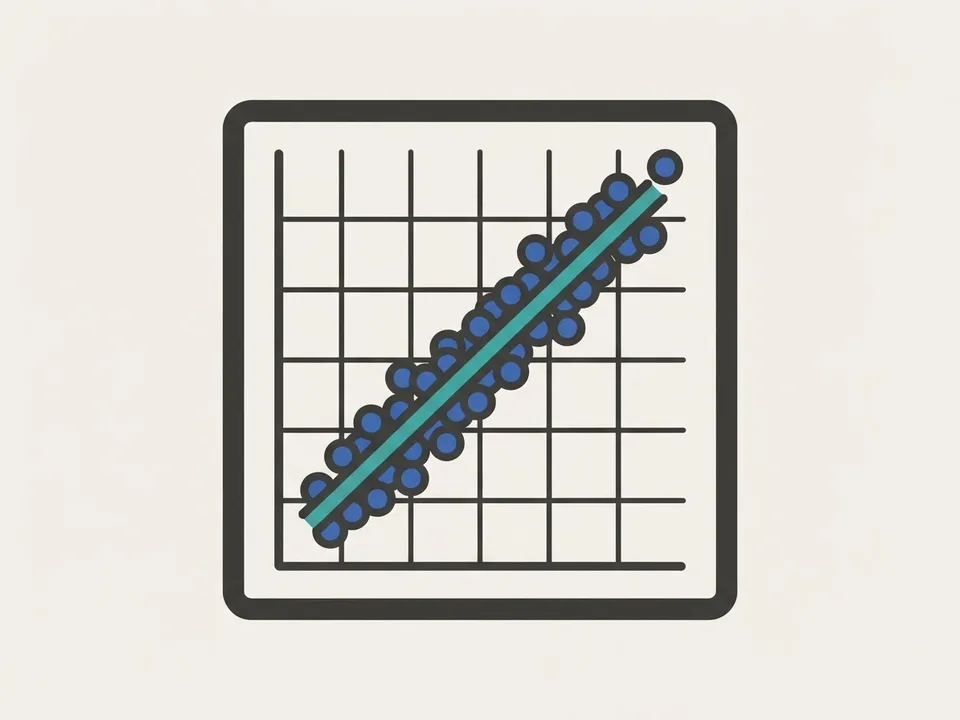
Hệ số tương quan là một con số đo độ mạnh và chiều của mối quan hệ tuyến tính giữa hai biến định lượng, luôn nhận giá trị trong khoảng từ −1 đến 1.The correlation coefficient is a single number that measures the strength and direction of the linear relationship between two quantitative variables, always between −1 and 1.
Trực giác: Hệ số tương quan giống như điểm số đánh giá mức độ các chấm trên đồ thị "chịu xếp hàng" theo một đường thẳng — điểm càng gần 1 hoặc −1 thì hàng càng thẳng, điểm gần 0 thì chấm nằm tứ tán.Intuition: Think of as a score for how willingly the dots in a scatterplot line up along a straight line: scores near 1 or −1 mean a tidy line, and scores near 0 mean the dots are scattered every which way.
Công thức chínhKey formula
Định nghĩa đầy đủFull definition1 phút đọc1 min read
Hệ số tương quan, thường ký hiệu , định lượng chiều và độ mạnh của liên hệ tuyến tính giữa hai biến định lượng. Dấu của cho biết chiều; càng gần 1, các điểm càng sát một đường thẳng; gần 0 cho thấy ít liên hệ tuyến tính.
Đại lượng này không có đơn vị và có thể bị ngoại lai làm lệch. không đồng nghĩa hai biến độc lập vì vẫn có thể tồn tại quan hệ phi tuyến.
The correlation coefficient, usually written , measures the direction and strength of the linear association between two quantitative variables. Its sign gives the direction; the closer is to 1, the more tightly the points cluster around a straight line, while values of near 0 indicate little linear association.
Correlation has no units, and outliers can pull it away from the pattern of the rest of the data. A value of does not mean the two variables are unrelated, since a nonlinear relationship may still be present.
- • — hệ số tương quan mẫu
- • (rho) — hệ số tương quan tổng thể
- • — sample correlation coefficient
- • (rho) — population correlation coefficient
Công thức chi tiếtFormula details2 công thức2 formulas
Dùng để đo chiều và độ mạnh của mối quan hệ tuyến tính giữa hai biến định lượng.Use this to measure the direction and strength of the linear relationship between two quantitative variables.
Trong đóWhere
Dùng khi biết hệ số góc của đường hồi quy bình phương nhỏ nhất và độ lệch chuẩn mẫu của hai biến.Use this when you know the slope of the least-squares regression line and the sample standard deviations of both variables.
Trong đóWhere
Hay hiểu saiCommon misconceptions3 ý · 1 phút đọc3 points · 1 min read
Hệ số tương quan mạnh không chứng minh quan hệ nhân quả.
Dữ liệu quan sát chỉ cho thấy hai biến cùng biến thiên; biến thứ ba có thể chi phối cả hai.
gần 0 không có nghĩa hai biến hoàn toàn không liên quan.
Hệ số này chỉ đo liên hệ tuyến tính, nên quan hệ phi tuyến mạnh vẫn có thể cho gần 0. Hãy xem biểu đồ phân tán; ngoại lai cũng có thể làm thay đổi đáng kể.
Đừng nhầm với .
cho biết chiều và độ mạnh của liên hệ tuyến tính; cho biết tỉ lệ biến thiên của biến phản hồi được mô hình đường thẳng giải thích. Khi suy từ , phải chọn dấu theo chiều liên hệ.
A strong correlation does not prove causation.
Observational data only show that two variables move together, and a third variable may be driving both.
An near 0 does not mean the two variables are unrelated.
Correlation measures only linear association, so a strong curved relationship can still give near 0; always look at the scatterplot, and remember that outliers can change substantially.
Do not confuse with .
The value gives the direction and strength of the linear association, while gives the proportion of variation in the response variable explained by the linear model; when finding from , choose the sign that matches the direction of the association.
Mẹo phòng thiExam tips2 mẹo2 tips
Trong mô hình đường thẳng, đọc đúng phần được giải thích.
Tỉ lệ được giải thích là ; tỉ lệ còn lại là . Khi suy từ , chọn dấu theo hệ số góc hoặc mô tả chiều; nếu thiếu manh mối, nêu cả hai khả năng.
Khi diễn giải , phải nêu đủ ba thành phần.
Nêu chiều, độ mạnh và liên hệ tuyến tính giữa hai biến trong ngữ cảnh của bài; thiếu chiều hoặc ngữ cảnh có thể mất điểm.
In a linear model, report the explained proportion correctly.
The explained proportion is and the unexplained proportion is ; when computing from , take the sign from the slope or from a stated direction, and if no clue is given, state both possibilities.
An interpretation of needs all three components.
Give the direction, the strength, and the fact that the association is linear, stated in the context of the problem; omitting the direction or the context can cost points.
Khái niệm này sinh ra từ đâuWhere the concept comes from1 phút đọc1 min read
1896Francis GaltonKarl PearsonAuguste Bravais
Vì sao mang đúng cái tên này? Tên gọi bắt nguồn từ chữ "co-relation" của Galton, nghĩa là hai đại lượng cùng biến thiên trong một mối quan hệ chung, về sau được viết gọn thành "correlation". Phần "hệ số" phản ánh đúng bản chất tính toán: đại lượng này là tỉ số giữa hiệp phương sai (covariance) của hai biến và tích hai độ lệch chuẩn (standard deviation) của chúng, nên nó chính là hiệp phương sai đã được chuẩn hóa và luôn rơi vào khoảng từ đến . Nhờ phép chuẩn hóa đó, kết quả không còn đơn vị, và ta có thể so sánh độ mạnh của mối liên hệ giữa những cặp biến đo bằng những đơn vị hoàn toàn khác nhau. Điều thú vị là cái tên đầy đủ "Pearson product-moment correlation coefficient" khiến nhiều người lầm tưởng Pearson tự mình nghĩ ra tất cả, trong khi ý tưởng gốc thuộc về Galton và công thức đã xuất hiện từ Bravais; vì vậy nó thường được nêu như một ví dụ kinh điển của luật Stigler (Stigler's Law) — quy luật nói rằng phát minh khoa học hiếm khi mang tên người thực sự tìm ra nó đầu tiên.
Thử nghiệm tương tácInteractive explorer
%22%20stroke-width%3D%222.4%22%2F%3E%3Ccircle%20cx%3D%22107.2%22%20cy%3D%22202.2%22%20r%3D%225.5%22%20fill%3D%22var(--accent-soft%2C%23ede9fe)%22%20stroke%3D%22var(--accent-strong%2C%237c3aed)%22%20stroke-width%3D%221.6%22%2F%3E%3Ccircle%20cx%3D%22164.4%22%20cy%3D%22135.7%22%20r%3D%225.5%22%20fill%3D%22var(--accent-soft%2C%23ede9fe)%22%20stroke%3D%22var(--accent-strong%2C%237c3aed)%22%20stroke-width%3D%221.6%22%2F%3E%3Ccircle%20cx%3D%22193.0%22%20cy%3D%22215.5%22%20r%3D%225.5%22%20fill%3D%22var(--accent-soft%2C%23ede9fe)%22%20stroke%3D%22var(--accent-strong%2C%237c3aed)%22%20stroke-width%3D%221.6%22%2F%3E%3Ccircle%20cx%3D%22221.6%22%20cy%3D%22122.4%22%20r%3D%225.5%22%20fill%3D%22var(--accent-soft%2C%23ede9fe)%22%20stroke%3D%22var(--accent-strong%2C%237c3aed)%22%20stroke-width%3D%221.6%22%2F%3E%3Ccircle%20cx%3D%22278.8%22%20cy%3D%22175.6%22%20r%3D%225.5%22%20fill%3D%22var(--accent-soft%2C%23ede9fe)%22%20stroke%3D%22var(--accent-strong%2C%237c3aed)%22%20stroke-width%3D%221.6%22%2F%3E%3Ccircle%20cx%3D%22336.0%22%20cy%3D%22162.3%22%20r%3D%225.5%22%20fill%3D%22var(--accent-soft%2C%23ede9fe)%22%20stroke%3D%22var(--accent-strong%2C%237c3aed)%22%20stroke-width%3D%221.6%22%2F%3E%3Ccircle%20cx%3D%22393.2%22%20cy%3D%2282.5%22%20r%3D%225.5%22%20fill%3D%22var(--accent-soft%2C%23ede9fe)%22%20stroke%3D%22var(--accent-strong%2C%237c3aed)%22%20stroke-width%3D%221.6%22%2F%3E%3Ccircle%20cx%3D%22450.4%22%20cy%3D%22175.6%22%20r%3D%225.5%22%20fill%3D%22var(--accent-soft%2C%23ede9fe)%22%20stroke%3D%22var(--accent-strong%2C%237c3aed)%22%20stroke-width%3D%221.6%22%2F%3E%3Ccircle%20cx%3D%22479.0%22%20cy%3D%2255.9%22%20r%3D%225.5%22%20fill%3D%22var(--accent-soft%2C%23ede9fe)%22%20stroke%3D%22var(--accent-strong%2C%237c3aed)%22%20stroke-width%3D%221.6%22%2F%3E%3Ccircle%20cx%3D%22507.6%22%20cy%3D%22135.7%22%20r%3D%225.5%22%20fill%3D%22var(--accent-soft%2C%23ede9fe)%22%20stroke%3D%22var(--accent-strong%2C%237c3aed)%22%20stroke-width%3D%221.6%22%2F%3E%3Ccircle%20cx%3D%22564.8%22%20cy%3D%2295.8%22%20r%3D%225.5%22%20fill%3D%22var(--accent-soft%2C%23ede9fe)%22%20stroke%3D%22var(--accent-strong%2C%237c3aed)%22%20stroke-width%3D%221.6%22%2F%3E%3Cline%20x1%3D%2250%22%20x2%3D%22622%22%20y1%3D%22282%22%20y2%3D%22282%22%20stroke%3D%22var(--text-faint%2C%2394a3b8)%22%20stroke-width%3D%221.2%22%2F%3E%3Cline%20x1%3D%2250%22%20x2%3D%2250%22%20y1%3D%2216%22%20y2%3D%22282%22%20stroke%3D%22var(--text-faint%2C%2394a3b8)%22%20stroke-width%3D%221.2%22%2F%3E%3Ctext%20x%3D%22320%22%20y%3D%22312%22%20text-anchor%3D%22middle%22%20font-size%3D%2212%22%20fill%3D%22var(--text-muted%2C%2364748b)%22%3EChi%20ph%C3%AD%20qu%E1%BA%A3ng%20c%C3%A1o%20h%E1%BA%B1ng%20th%C3%A1ng%20(tri%E1%BB%87u%20%C4%91%E1%BB%93ng)%3C%2Ftext%3E%3Ctext%20x%3D%2214%22%20y%3D%22149%22%20text-anchor%3D%22middle%22%20font-size%3D%2212%22%20fill%3D%22var(--text-muted%2C%2364748b)%22%20transform%3D%22rotate(-90%2014%20149)%22%3EDoanh%20thu%20h%E1%BA%B1ng%20th%C3%A1ng%20(ch%E1%BB%A5c%20tri%E1%BB%87u%20%C4%91%E1%BB%93ng)%3C%2Ftext%3E%3C%2Fsvg%3E)
Kéo đám điểm — nhìn kim $r$ chạy từ $-1$ đến $+1$
Kéo tham số, thấy khái niệm chuyển động — đăng nhập để mở.Drag the parameters and watch the concept move — sign in to open.
Bạn nắm chắc chưa?Check your understanding
Quiz câu thật từ ngân hàng đềReal exam questions from our question bank
Vài câu thật gắn đúng khái niệm này, chấm ngay kèm giải thích từng đáp án — hệ thống ghi nhớ bạn nắm tới đâu.A few real questions on exactly this concept, graded instantly with an explanation for every choice — the system remembers how well you know it.
Học tiếp từ đâyKeep learning
Hay nhầm vớiOften confused with
Cùng chủ đềSame topic
- liên hệ tuyến tínhlinear association
- mối quan hệ âmnegative relationship
- mối quan hệ thuậnpositive relationship
- tương quancorrelation
- biến giải thíchexplanatory variable
- chiều của mối liên hệdirection of association
- dạng của mối liên hệform of association
- dữ liệu hai biếnbivariate data
- mối liên hệ âmnegatively associated
- mối liên hệ thuậnpositively associated
- biến phản hồiresponse variable
- biểu đồ phần dưresidual plot
Nguồn tham khảoReferences
- [1]Barron_AP_Stat_2026. tr. 33, 154, 168.
Biên soạn bởi DucklingStudy, bản quyền thuộc DucklingStudy.Written by DucklingStudy. © DucklingStudy. Xuất bảnPublished .