

AP Statistics
phân phối chuẩnnormal distribution
normal distributionVietnamese: phân phối chuẩn
Còn gọi:Also called: phân phối Gauss · đường cong chuông
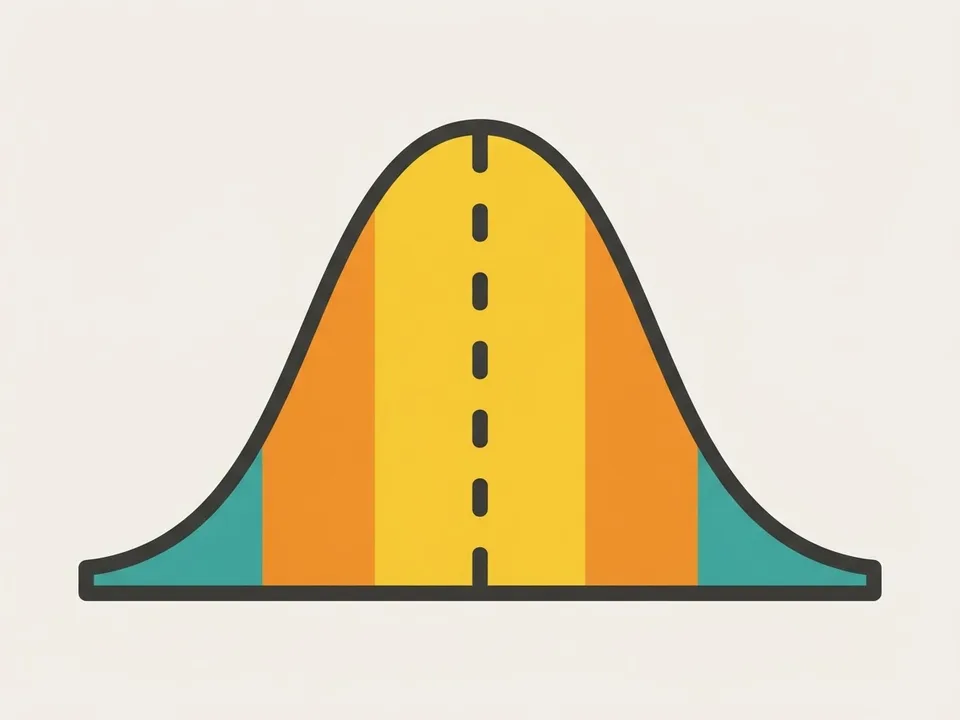
Phân phối chuẩn là phân phối xác suất liên tục đối xứng hình chuông, xác định bởi trung bình μ và độ lệch chuẩn σ, nền của quy tắc 68–95–99,7.The normal distribution is a symmetric, bell-shaped continuous probability distribution determined by its mean μ and standard deviation σ, and it underlies the 68–95–99.7 rule.
Trực giác: Hình chuông đối xứng: biết đỉnh nằm đâu (μ) và chuông béo cỡ nào (σ) là biết tất cả.Intuition: Picture a symmetric bell: once you know where the peak sits (μ) and how wide the bell is (σ), you know the whole distribution.
Công thức chínhKey formula
Định nghĩa đầy đủFull definition1 phút đọc1 min read
Đường cong chuẩn đối xứng quanh : trung bình, trung vị và mốt trùng nhau tại đỉnh. Tham số quyết định độ “béo” của chuông — nhỏ thì nhọn và túm tụm, lớn thì bè và trải rộng.
Quy tắc thực nghiệm (68–95–99,7): khoảng chứa ≈ 68% dữ liệu, chứa ≈ 95%, chứa ≈ 99,7%. Mọi phân phối chuẩn đều đưa được về phân phối chuẩn tắc qua phép chuẩn hoá .
A normal distribution has a bell-shaped curve that is symmetric about , so the mean, median, and mode all coincide at the peak. The parameter controls how wide the bell is: a small gives a tall, narrow curve, while a large gives a flatter, more spread-out curve.
The empirical rule (68–95–99.7): about 68% of the data fall within , about 95% within , and about 99.7% within . Any normal distribution can be converted to the standard normal distribution by standardizing with .
Giải nghĩa công thứcFormula breakdown1 công thức1 formula
Chuẩn hoá: x cách trung bình bao nhiêu ĐỘ LỆCH CHUẨN — cây cầu sang bảng z và mọi bài tính xác suất chuẩn.Standardizing tells you how many STANDARD DEVIATIONS lies from the mean — the bridge to the z-table and to every normal probability calculation.
Trong đóWhere
Hay hiểu saiCommon misconceptions3 ý · 1 phút đọc3 points · 1 min read
Áp quy tắc 68–95–99,7 cho dữ liệu KHÔNG chuẩn — quy tắc chỉ đúng khi phân phối xấp xỉ chuẩn.
Vẽ phác vùng cần tính trước: bảng z cho đuôi trái, rất dễ đọc nhầm thành đuôi phải.
Nghĩ đường cong chuẩn chạm trục hoành tại — nó tiệm cận, không bao giờ chạm.
The 68–95–99.7 rule does not apply to data that are not roughly normal.
The percentages come from the shape of the normal curve itself, so a skewed or bimodal distribution will give very different proportions.
Sketch and shade the region you want before you use a z-table.
Tables report the area to the LEFT of a z-score, and it is easy to read that value as a right-tail area by mistake.
The normal curve never touches the horizontal axis at .
The tails are asymptotic: they get closer and closer to the axis but always keep a tiny bit of area beyond any point.
Mẹo phòng thiExam tips1 mẹo1 tip
FRQ xác suất chuẩn phải đủ ba phần: nêu , chuẩn hoá, kết luận trong ngữ cảnh.
A normal-probability FRQ needs three parts: state , standardize, and conclude in context.
Graders award credit separately for naming the distribution, showing the calculation, and interpreting the probability in the setting of the problem.
Thử nghiệm tương tácInteractive explorer
%22%20opacity%3D%220.85%22%2F%3E%3Cpath%20d%3D%22M46.0%2C305.5%20L49.6%2C305.5%20L53.2%2C305.4%20L56.8%2C305.3%20L60.5%2C305.2%20L64.1%2C305.0%20L67.7%2C304.9%20L71.3%2C304.7%20L74.9%2C304.5%20L78.5%2C304.2%20L82.1%2C304.0%20L85.7%2C303.7%20L89.3%2C303.3%20L93.0%2C302.9%20L96.6%2C302.5%20L100.2%2C302.0%20L103.8%2C301.5%20L107.4%2C300.9%20L111.0%2C300.2%20L114.6%2C299.4%20L118.3%2C298.6%20L121.9%2C297.6%20L125.5%2C296.6%20L129.1%2C295.5%20L132.7%2C294.2%20L136.3%2C292.8%20L139.9%2C291.3%20L143.5%2C289.7%20L147.1%2C287.9%20L150.8%2C285.9%20L154.4%2C283.8%20L158.0%2C281.5%20L161.6%2C279.0%20L165.2%2C276.3%20L168.8%2C273.4%20L172.4%2C270.3%20L176.1%2C267.0%20L179.7%2C263.5%20L183.3%2C259.7%20L186.9%2C255.7%20L190.5%2C251.5%20L194.1%2C247.0%20L197.7%2C242.3%20L201.3%2C237.4%20L205.0%2C232.2%20L208.6%2C226.8%20L212.2%2C221.1%20L215.8%2C215.3%20L219.4%2C209.2%20L223.0%2C202.9%20L226.6%2C196.5%20L230.2%2C189.9%20L233.8%2C183.1%20L237.5%2C176.1%20L241.1%2C169.1%20L244.7%2C162.0%20L248.3%2C154.7%20L251.9%2C147.5%20L255.5%2C140.2%20L259.1%2C133.0%20L262.8%2C125.8%20L266.4%2C118.6%20L270.0%2C111.6%20L273.6%2C104.7%20L277.2%2C97.9%20L280.8%2C91.4%20L284.4%2C85.1%20L288.0%2C79.1%20L291.6%2C73.4%20L295.3%2C68.0%20L298.9%2C62.9%20L302.5%2C58.3%20L306.1%2C54.1%20L309.7%2C50.3%20L313.3%2C46.9%20L316.9%2C44.1%20L320.6%2C41.7%20L324.2%2C39.9%20L327.8%2C38.5%20L331.4%2C37.7%20L335.0%2C37.5%20L338.6%2C37.7%20L342.2%2C38.5%20L345.8%2C39.9%20L349.4%2C41.7%20L353.1%2C44.1%20L356.7%2C46.9%20L360.3%2C50.3%20L363.9%2C54.1%20L367.5%2C58.3%20L371.1%2C62.9%20L374.7%2C68.0%20L378.3%2C73.4%20L382.0%2C79.1%20L385.6%2C85.1%20L389.2%2C91.4%20L392.8%2C97.9%20L396.4%2C104.7%20L400.0%2C111.6%20L403.6%2C118.6%20L407.3%2C125.8%20L410.9%2C133.0%20L414.5%2C140.2%20L418.1%2C147.5%20L421.7%2C154.7%20L425.3%2C162.0%20L428.9%2C169.1%20L432.5%2C176.1%20L436.2%2C183.1%20L439.8%2C189.9%20L443.4%2C196.5%20L447.0%2C202.9%20L450.6%2C209.2%20L454.2%2C215.3%20L457.8%2C221.1%20L461.4%2C226.8%20L465.1%2C232.2%20L468.7%2C237.4%20L472.3%2C242.3%20L475.9%2C247.0%20L479.5%2C251.5%20L483.1%2C255.7%20L486.7%2C259.7%20L490.3%2C263.5%20L493.9%2C267.0%20L497.6%2C270.3%20L501.2%2C273.4%20L504.8%2C276.3%20L508.4%2C279.0%20L512.0%2C281.5%20L515.6%2C283.8%20L519.2%2C285.9%20L522.8%2C287.9%20L526.5%2C289.7%20L530.1%2C291.3%20L533.7%2C292.8%20L537.3%2C294.2%20L540.9%2C295.5%20L544.5%2C296.6%20L548.1%2C297.6%20L551.8%2C298.6%20L555.4%2C299.4%20L559.0%2C300.2%20L562.6%2C300.9%20L566.2%2C301.5%20L569.8%2C302.0%20L573.4%2C302.5%20L577.0%2C302.9%20L580.6%2C303.3%20L584.3%2C303.7%20L587.9%2C304.0%20L591.5%2C304.2%20L595.1%2C304.5%20L598.7%2C304.7%20L602.3%2C304.9%20L605.9%2C305.0%20L609.5%2C305.2%20L613.2%2C305.3%20L616.8%2C305.4%20L620.4%2C305.5%20L624.0%2C305.5%22%20fill%3D%22none%22%20stroke%3D%22var(--info%2C%232563eb)%22%20stroke-width%3D%222.4%22%2F%3E%3Cline%20x1%3D%2246%22%20x2%3D%22624%22%20y1%3D%22306%22%20y2%3D%22306%22%20stroke%3D%22var(--text-faint%2C%2394a3b8)%22%20stroke-width%3D%221.2%22%2F%3E%3Ctext%20x%3D%22320%22%20y%3D%22334%22%20text-anchor%3D%22middle%22%20font-size%3D%2212%22%20fill%3D%22var(--text-muted%2C%2364748b)%22%3EChi%E1%BB%81u%20cao%20h%E1%BB%8Dc%20sinh%20l%E1%BB%9Bp%2012%20(cm)%3C%2Ftext%3E%3C%2Fsvg%3E)
Kéo hai mốc a và b — nhìn xác suất chính là phần diện tích bị tô
Kéo tham số, thấy khái niệm chuyển động — đăng nhập để mở.Drag the parameters and watch the concept move — sign in to open.
Bạn nắm chắc chưa?Check your understanding
Quiz câu thật từ ngân hàng đềReal exam questions from our question bank
Vài câu thật gắn đúng khái niệm này, chấm ngay kèm giải thích từng đáp án — hệ thống ghi nhớ bạn nắm tới đâu.A few real questions on exactly this concept, graded instantly with an explanation for every choice — the system remembers how well you know it.
Học tiếp từ đâyKeep learning
Cùng chủ đềSame topic
- biến ngẫu nhiên liên tụccontinuous random variable
- đường cong chuẩnnormal curve
- phân phối chi bình phươngchi-square distribution
- phân phối chuẩn tắcstandard normal distribution
- phân phối đối xứngsymmetric distribution
- phân phối hình chuôngmound-shaped
- quy tắc thực nghiệmempirical rule
- thứ hạng bách phân vịpercentile rank
- z-scorez-score
Nguồn tham khảoReferences
- [1]Barron_AP_Stat_2026. tr. 144–148.
Biên soạn bởi DucklingStudy, bản quyền thuộc DucklingStudy.Written by DucklingStudy. © DucklingStudy. Xuất bảnPublished .