

AP Statistics
hình dạng (của phân phối)shape
shapeVietnamese: hình dạng (của phân phối)
Còn gọi:Also called: dạng phân phối
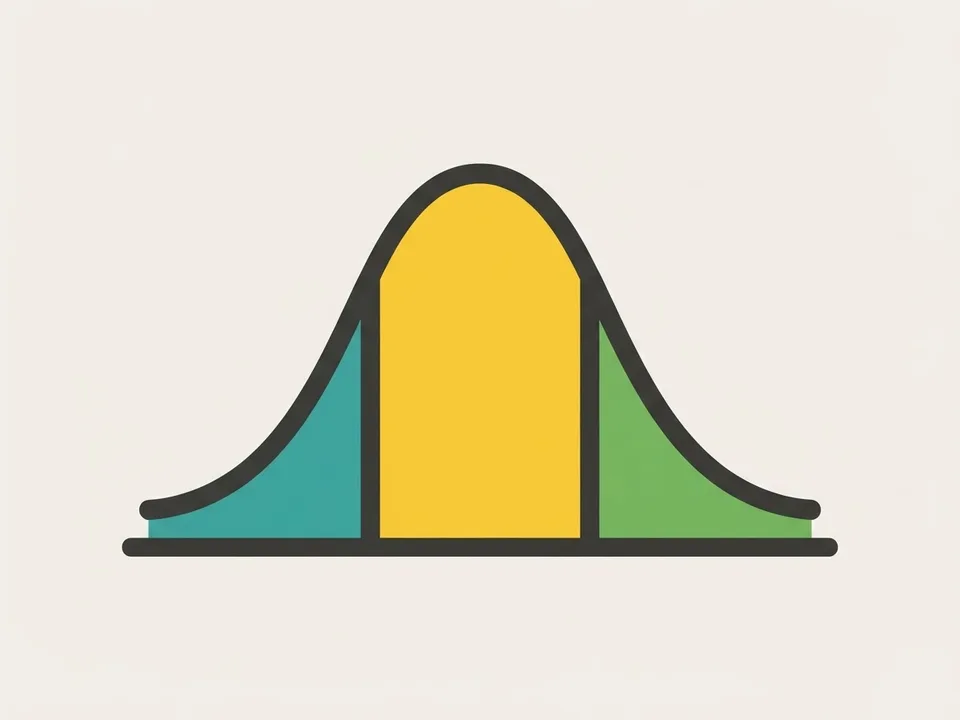
Hình dạng phân phối là dáng tổng thể của đồ thị dữ liệu: đối xứng hay lệch, một đỉnh hay nhiều đỉnh, cho biết dữ liệu dồn về đâu trên trục số.The shape of a distribution is the overall form of a graph of data: symmetric or skewed, single-peaked or multi-peaked, showing where the data pile up along the number line.
Trực giác: Hình dạng phân phối như dáng núi nhìn từ trên cao: núi cân đối hai bên là đối xứng, sườn nào dài ra xa là lệch về phía đó.Intuition: Think of a distribution as a mountain seen from a distance: a mountain with balanced sides is symmetric, and whichever slope stretches far out is the direction of the skew.
Định nghĩa đầy đủFull definition1 phút đọc1 min read
Hình dạng của phân phối là dáng tổng thể của đồ thị biến định lượng, gồm tính đối xứng, độ lệch, độ đều và số đỉnh. Phân phối đối xứng có hai nửa gần phản chiếu qua tâm; phân phối lệch được gọi theo phía đuôi dài, không theo nơi dữ liệu tập trung.
Hình dạng không đổi khi trục dọc dùng tần số hoặc tần số tương đối vì các cột chỉ đổi theo cùng một tỉ lệ. Hình dạng là một khía cạnh riêng với tâm, độ phân tán và điểm bất thường.
The shape of a distribution is the overall form of a graph of a quantitative variable, including symmetry, skewness, uniformity, and the number of peaks. A symmetric distribution has two halves that nearly mirror each other about its center; a skewed distribution is named for the side with the long tail, not for the side where the data cluster.
Shape does not change when the vertical axis shows frequency instead of relative frequency, because every bar is rescaled by the same factor. Shape is a separate feature from center, spread, and unusual values.
Hay hiểu saiCommon misconceptions3 ý · 1 phút đọc3 points · 1 min read
Độ lệch được gọi theo phía đuôi dài.
Dữ liệu có thể dồn bên trái nhưng vẫn lệch phải nếu đuôi bên phải dài hơn.
không chứng minh dữ liệu gốc có phân phối chuẩn.
Hai điều kiện và chỉ dùng để xét xấp xỉ chuẩn cho phân phối mẫu của tỉ lệ mẫu.
Không dùng đối xứng, lệch hay đơn đỉnh cho biến phân loại.
Thứ tự cột có thể do người vẽ chọn; hãy so sánh tỉ lệ các loại thay vì mô tả hình dạng.
Skewness is named for the long tail, not for the cluster of data.
Data can pile up on the left and still be skewed right if the right tail is longer.
does not show that the original data are normally distributed.
The conditions and only justify a normal approximation for the sampling distribution of a sample proportion.
Do not describe a categorical variable as symmetric, skewed, or unimodal.
The order of the bars is often chosen by whoever made the graph, so compare the proportions in each category instead of the shape.
Mẹo phòng thiExam tips2 mẹo2 tips
Khi so sánh hình dạng, phải đối chiếu trực tiếp.
Hãy viết phân phối nào lệch mạnh hơn hoặc gần đối xứng hơn, đồng thời nêu bối cảnh và đơn vị.
Chọn trung vị và khoảng tứ phân vị khi phân phối lệch hoặc có điểm tách biệt.
Trong bối cảnh này, chúng mô tả dữ liệu tốt hơn trung bình và độ lệch chuẩn.
When comparing shapes, make the comparison explicit.
State which distribution is more strongly skewed or closer to symmetric, and include context and units.
Use the median and interquartile range when a distribution is skewed or has separated values.
In that situation they describe the data better than the mean and standard deviation.
Thử nghiệm tương tácInteractive explorer
%22%20stroke%3D%22var(--accent-strong%2C%237c3aed)%22%20stroke-width%3D%221.2%22%2F%3E%3Crect%20x%3D%22104.3%22%20y%3D%22266.0%22%20width%3D%2256.8%22%20height%3D%220.0%22%20fill%3D%22var(--accent-soft%2C%23ede9fe)%22%20stroke%3D%22var(--accent-strong%2C%237c3aed)%22%20stroke-width%3D%221.2%22%2F%3E%3Crect%20x%3D%22162.1%22%20y%3D%22248.0%22%20width%3D%2256.8%22%20height%3D%2218.0%22%20fill%3D%22var(--accent-soft%2C%23ede9fe)%22%20stroke%3D%22var(--accent-strong%2C%237c3aed)%22%20stroke-width%3D%221.2%22%2F%3E%3Crect%20x%3D%22219.9%22%20y%3D%22194.0%22%20width%3D%2256.8%22%20height%3D%2272.0%22%20fill%3D%22var(--accent-soft%2C%23ede9fe)%22%20stroke%3D%22var(--accent-strong%2C%237c3aed)%22%20stroke-width%3D%221.2%22%2F%3E%3Crect%20x%3D%22277.7%22%20y%3D%2250.0%22%20width%3D%2256.8%22%20height%3D%22216.0%22%20fill%3D%22var(--accent-soft%2C%23ede9fe)%22%20stroke%3D%22var(--accent-strong%2C%237c3aed)%22%20stroke-width%3D%221.2%22%2F%3E%3Crect%20x%3D%22335.5%22%20y%3D%2214.0%22%20width%3D%2256.8%22%20height%3D%22252.0%22%20fill%3D%22var(--accent-soft%2C%23ede9fe)%22%20stroke%3D%22var(--accent-strong%2C%237c3aed)%22%20stroke-width%3D%221.2%22%2F%3E%3Crect%20x%3D%22393.3%22%20y%3D%22176.0%22%20width%3D%2256.8%22%20height%3D%2290.0%22%20fill%3D%22var(--accent-soft%2C%23ede9fe)%22%20stroke%3D%22var(--accent-strong%2C%237c3aed)%22%20stroke-width%3D%221.2%22%2F%3E%3Crect%20x%3D%22451.1%22%20y%3D%22248.0%22%20width%3D%2256.8%22%20height%3D%2218.0%22%20fill%3D%22var(--accent-soft%2C%23ede9fe)%22%20stroke%3D%22var(--accent-strong%2C%237c3aed)%22%20stroke-width%3D%221.2%22%2F%3E%3Crect%20x%3D%22508.9%22%20y%3D%22266.0%22%20width%3D%2256.8%22%20height%3D%220.0%22%20fill%3D%22var(--accent-soft%2C%23ede9fe)%22%20stroke%3D%22var(--accent-strong%2C%237c3aed)%22%20stroke-width%3D%221.2%22%2F%3E%3Crect%20x%3D%22566.7%22%20y%3D%22266.0%22%20width%3D%2256.8%22%20height%3D%220.0%22%20fill%3D%22var(--accent-soft%2C%23ede9fe)%22%20stroke%3D%22var(--accent-strong%2C%237c3aed)%22%20stroke-width%3D%221.2%22%2F%3E%3Cline%20x1%3D%2246%22%20x2%3D%22624%22%20y1%3D%22266%22%20y2%3D%22266%22%20stroke%3D%22var(--text-faint%2C%2394a3b8)%22%20stroke-width%3D%221.2%22%2F%3E%3Ctext%20x%3D%22320%22%20y%3D%22294%22%20text-anchor%3D%22middle%22%20font-size%3D%2212%22%20fill%3D%22var(--text-muted%2C%2364748b)%22%3Egi%C3%A1%20tr%E1%BB%8B%20quan%20s%C3%A1t%20(thang%200%E2%80%93100)%3C%2Ftext%3E%3C%2Fsvg%3E)
Nặn đám dữ liệu — xem hình dạng đổi, trung bình và trung vị chạy theo
Kéo tham số, thấy khái niệm chuyển động — đăng nhập để mở.Drag the parameters and watch the concept move — sign in to open.
Bạn nắm chắc chưa?Check your understanding
Quiz câu thật từ ngân hàng đềReal exam questions from our question bank
Vài câu thật gắn đúng khái niệm này, chấm ngay kèm giải thích từng đáp án — hệ thống ghi nhớ bạn nắm tới đâu.A few real questions on exactly this concept, graded instantly with an explanation for every choice — the system remembers how well you know it.
Học tiếp từ đâyKeep learning
Hay nhầm vớiOften confused with
Cùng chủ đềSame topic
- biểu đồ chấmdotplot
- biểu đồ thân–lástemplot
- histogramhistogram
- phân phối lệchskewed
- phân phối lệch phảiskewed right
- biến định lượngquantitative variable
- boxplotboxplot
- dữ liệu đơn biếnunivariate data
- đặc điểm bất thường (của phân phối)unusual features
- hai đỉnhbimodal
- khoảng trống (trong phân phối dữ liệu)gap
- một đỉnhunimodal
Nguồn tham khảoReferences
- [1]Barron_AP_Stat_2026. tr. 22, 35, 88.
Biên soạn bởi DucklingStudy, bản quyền thuộc DucklingStudy.Written by DucklingStudy. © DucklingStudy. Xuất bảnPublished .